In today’s rapidly evolving technological landscape, the combination of imaging-based 3D modelling with sensor data capture is gaining critical importance. This article explores how photogrammetry software and a data acquisition system work together to unlock powerful new capabilities — especially for businesses in precision measurement, surveying, inspection, infrastructure monitoring and related fields (such as those served by niche technology providers like DAE Tech Systems).
Understanding the Key Terms
What is photogrammetry software?
Photogrammetry software is the toolset that processes multiple overlapping photographs or images of a physical object, structure or terrain to reconstruct its three-dimensional geometry, surfaces and textures. For example, the software will extract 3D points and build models by triangulating corresponding image features from different viewpoints.
In practical terms, this means:
- Capturing images via drones, handheld cameras or terrestrial setups
- Uploading them into the photogrammetry software
- Running workflows that generate a digital 3D model, point cloud, or mesh of the object/scene
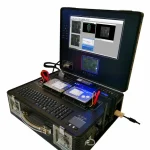
What is a data acquisition system?
A data acquisition system (DAQ) refers to the hardware + software setup that collects, digitises, records and sometimes transmits sensor-derived data (such as temperature, vibration, strain, motion, displacement, etc.). In engineering and industrial contexts, a DAQ is responsible for sampling analog or digital inputs, synchronising channels, logging data and providing analytics downstream.
In short: photogrammetry captures “what it looks like / 3-D shape”, and a DAQ captures “what is happening / dynamic data”.
Why Combine Photogrammetry Software + Data Acquisition Systems?

Integrating photogrammetry software with a data acquisition system enables a holistic “what + how” view of assets and environments. Here are the core benefits:
- Rich contextual modelling: Using photogrammetry software, you reconstruct a 3D model of the site or object. Then via the DAQ you overlay sensor data (strain, displacement, temperature, etc) within that 3D context for spatially-aware analysis.
- Visualised dynamic behaviour: Rather than sensors floating in isolation, you can visualise how forces, deformations or movements occur on the actual geometry captured using photogrammetry.
- Better decision-making: Maintenance, inspection or survey teams get a unified view — geometry + data — simplifying root-cause analysis.
- Scalable workflows: Once set up, you can deploy photogrammetry + DAQ across multiple sites (e.g., infrastructure corridors, buildings) and replicate the approach.
- Enhanced off-line analytics / reporting: The 3D model acts as a persistent asset; the DAQ data adds temporal layers — enabling historical review, trend detection and simulation.
For companies specialising in industrial monitoring or inspection systems (such as DAE Tech Systems), embedding photogrammetry software capability into their DAQ-centric workflows gives a competitive edge: you’re not just capturing numbers, you’re capturing spatially rich insight.
How the Workflow Typically Plays Out
Here’s a step-by-step breakdown of how photogrammetry software and a data acquisition system can be tied together:
1. Planning & Sensor Setup
- Define what you want to capture: e.g., structural deformation under load, vibration across a facade, thermal changes on a rooftop.
- Set up the data acquisition system: install sensors, specify channels, sample rates, synchronisation.
- Plan the image capture sequence: camera positions, lighting, coverage, overlap so that the photogrammetry software will have sufficient input.
2. Image Acquisition
- Capture high-resolution overlapping images (for example via drone or tripod) to cover the object/scene thoroughly.
- Ensure good coverage, correct exposure, and consistent vantage points to improve the photogrammetry outcome.
3. Sensor Data Collection
- While or after image capture, the DAQ system logs sensor readings simultaneously (or in time-aligned fashion).
- For moving or dynamic events, synchronisation becomes critical so that photogrammetry and sensor data reference the same event window.
4. Photogrammetry Processing
- Import images into the photogrammetry software.
- The software identifies common features, triangulates them, builds point clouds or meshes and aligns coordinate systems.
- The result: a 3D model of the object/scene with accurate geometry.
5. Sensor Data Integration & Alignment
- Map the sensor positions or “channels” onto the 3D model (either manually or via coordinates).
- Synchronise the temporal data from DAQ with the spatial model (for example, showing deformation at sensor A at timestamp T on the 3-D model).
- Use visualisations: sensor paths, colour-coded heatmaps, motion overlays.
6. Analysis, Reporting & Insight
- Inspect where the highest stresses or thermal hotspots occur in the visualised model.
- Produce reports or dashboards showing geometry + behaviour (e.g., “sensor 7 measured 2.5 mm displacement at the north wall joint while the photogrammetry model shows opening of 0.8 mm gap”).
- Archive the geometry model and link subsequent sensor captures to compare over time.
7. Iteration & Monitoring
- For ongoing monitoring, repeat the image capture + sensor logging periodically.
- Use the existing model as baseline, then compare new data sets to detect anomalies, shifts or deterioration.
Challenges and Practical Considerations
While the combined approach is powerful, there are a few practical considerations to keep in mind.
- Quality of imagery: If the photogrammetry software input lacks good overlap, lighting or angle diversity, the 3D model will suffer accuracy issues.
- Sensor-model alignment: Mapping sensors to the 3D model requires good coordinate registration; errors here reduce the usability of the overlay.
- Data volume & processing time: High-resolution image sets + multi-channel DAQ data mean larger storage, more processing time and higher compute requirements.
- Synchronization: Especially for dynamic events, ensuring that the DAQ timestamps align with image capture or relevant event windows is key.
- Integration software: The tools used must support combining spatial geometry from the photogrammetry software with time-series sensor data—sometimes requiring custom workflows or third-party software.
- Repeatability & reference geometry: If you are doing long-term monitoring, keeping consistent image capture conditions, sensor placement, and coordinate systems is critical for credible comparison.
Use-Case Examples: Where This Combination Shines
Infrastructure & civil engineering
Imagine monitoring a bridge joint: photogrammetry software builds the 3D geometry of the joint and moving elements. A DAQ collects sensor data such as strain gauges and accelerometers under varying load. The result: you see exactly where the greatest deformation occurs, visualised on the model.
Surveying & as-built documentation
When documenting the as-built state of a facility, photogrammetry captures the geometry; sensors capture environmental or structural behaviour (e.g., temperature gradients in a plant). Maintenance teams get a full picture: geometry of the asset + how it’s performing in real time.
Manufacturing & component inspection
In precision manufacturing, photogrammetry might model a machined part, while a DAQ system records vibration, acoustic emission or thermal response during testing. Engineers map performance data onto the part’s 3D geometry to detect weak points.
Heritage / inspection of inaccessible assets
For assets that are partially inaccessible (e.g., tall towers or offshore structures), drones capture imagery for photogrammetry, while a remote DAQ captures sensor data like tilt, vibration or corrosion-indicators. Combined, you get spatially accurate condition monitoring.
How Companies Like DAE Tech Systems Fit In
While many companies focus either on imagery or sensor-systems alone, firms with a dual-focus (geometry + data acquisition) are uniquely positioned. A company such as DAE Tech Systems, by virtue of servicing high-precision acquisition systems, can deliver integrated solutions: hardware, sensors, DAQ software plus photogrammetry-compatible data pipelines. Their niche advantage lies in offering turnkey packages where geometry modelling and sensor analytics co-exist seamlessly — reducing integration overhead, simplifying workflows, and accelerating time-to-insight for clients.
Best Practices for Beginners
- Start small: Choose a smaller asset (e.g., a facade, machine part) to pilot the workflow—image acquisition, DAQ logging, model building, overlaying data.
- Choose good photogrammetry software: Many options exist; look for capabilities like automatic tie-point detection, mesh generation and export of coordinate models.
- Synchronise early: Make sure your DAQ system timestamps or event flags can be aligned with image capture events.
- Document everything: Survey the scene once (take control points), log sensor positions, capture camera parameters — good metadata helps later analysis.
- Maintain coordinate consistency: If you will monitor periodically, keep the same coordinate reference frame for your geometry and sensor data.
- Automate reporting where possible: Once you have the model + data flow set up, generate dashboards or visualisations automatically to make your results understandable to non-technical stakeholders.
- Train your team: Even if the technical tools are advanced, the value comes from interpreting what the geometry + data mean for business decisions.
Summary
Bringing together photogrammetry software and a data acquisition system unlocks far greater value than either technology in isolation. With geometry, image-based 3-D modelling gives you the “shape” of your asset or environment. With the DAQ system, you add behaviour, measurement, dynamics. The synergy: you can see not just how your asset looks, but how it performs.
For companies specialising in precision acquisition, modelling and monitoring, embracing this integrated workflow is a key differentiator. For beginners and seasoned professionals alike, the path is now clear: capture the scene, capture the data, link them together — and gain actionable insight.